

Lubrication Data Reveals Suspected Fan DE Mechanical Looseness
Motor Direct-Drive Fan Assembly | Rock Crushing Plant | SDT340
The SDT340 LUBExpert Mode guides technicians through lubrication tasks while collecting dynamic data that can be reviewed later as part of a larger condition monitoring investigation. This case study follows a motor direct-drive fan assembly at a rock crushing plant. There was no historical ultrasound, vibration, or lubrication data available for the technician to baseline with. Each measurement served two purposes: support the lubrication decision in the field and begin building a baseline condition monitoring record. The route included four points in the following order: Motor NDE, Motor DE, Fan DE, and Fan NDE. The time waveform data was used to compare friction response before and after lubrication. The FFT spectrum data was then used to look deeper for mechanical patterns that lubrication may reduce, but not correct.Time Waveform Summary

1. Lubrication Response: Before and After Time Waveforms
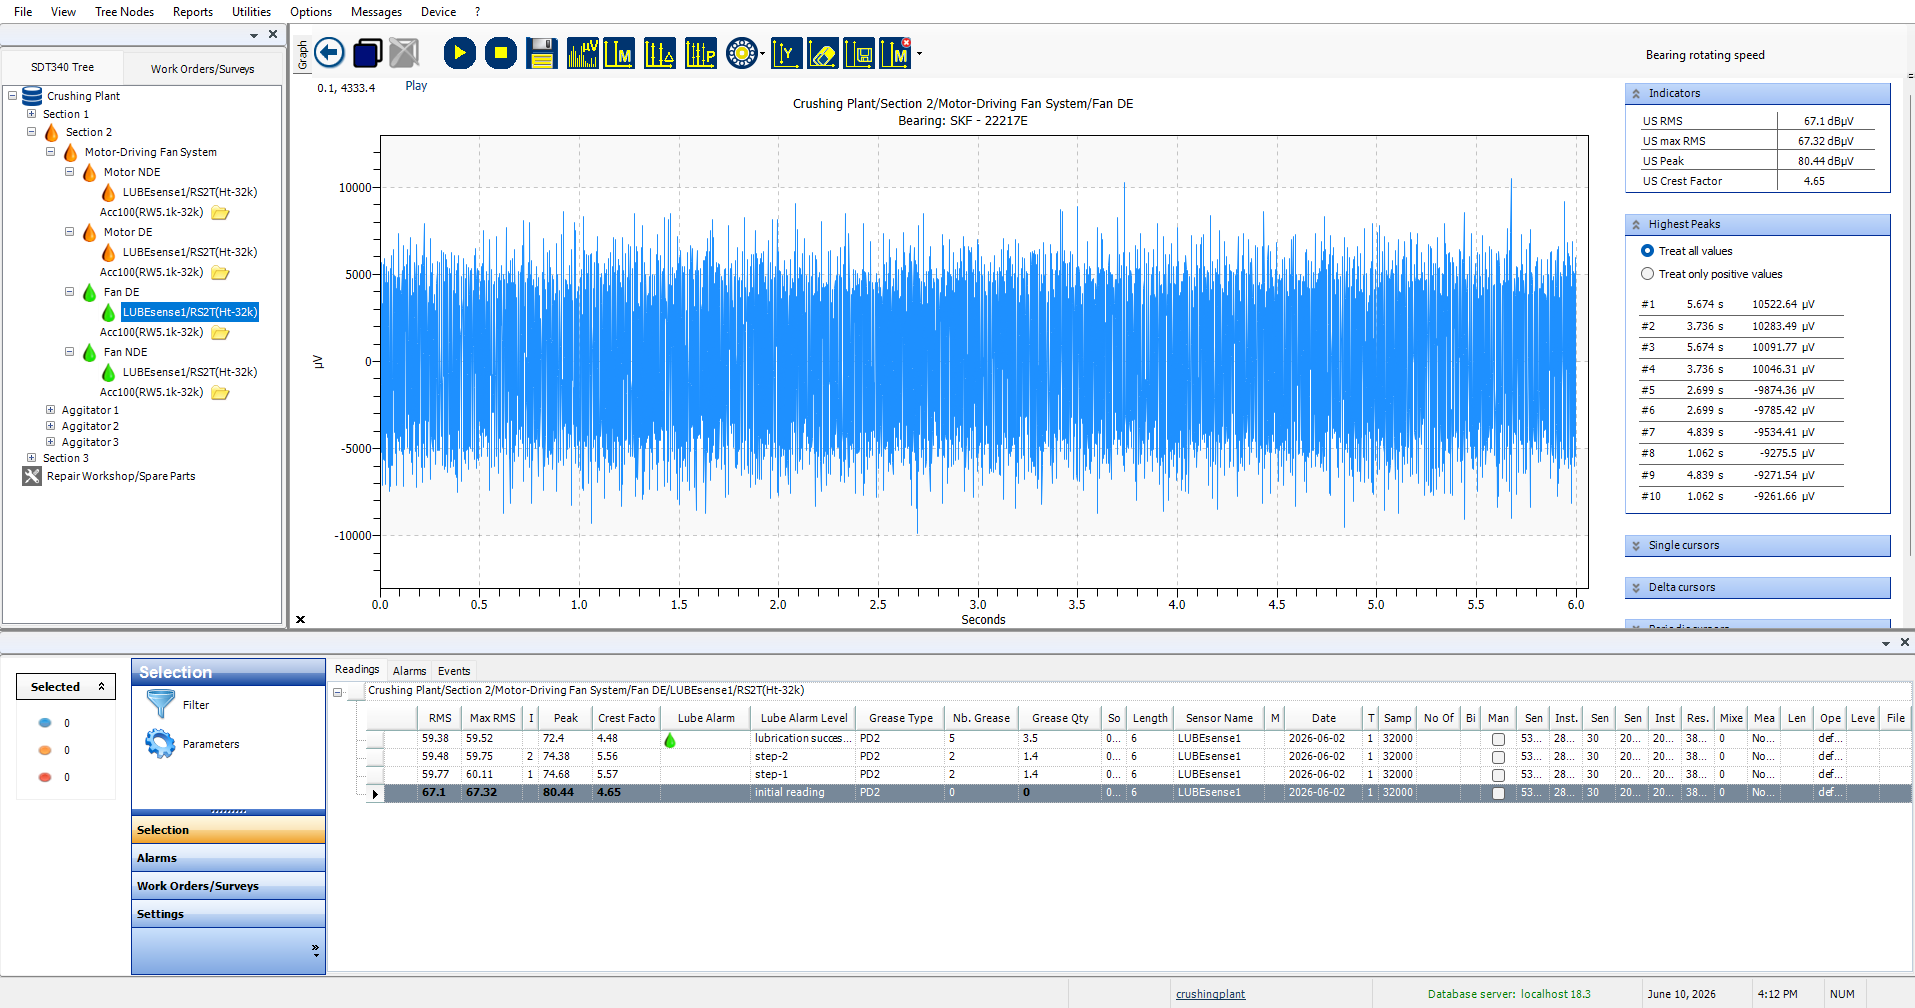
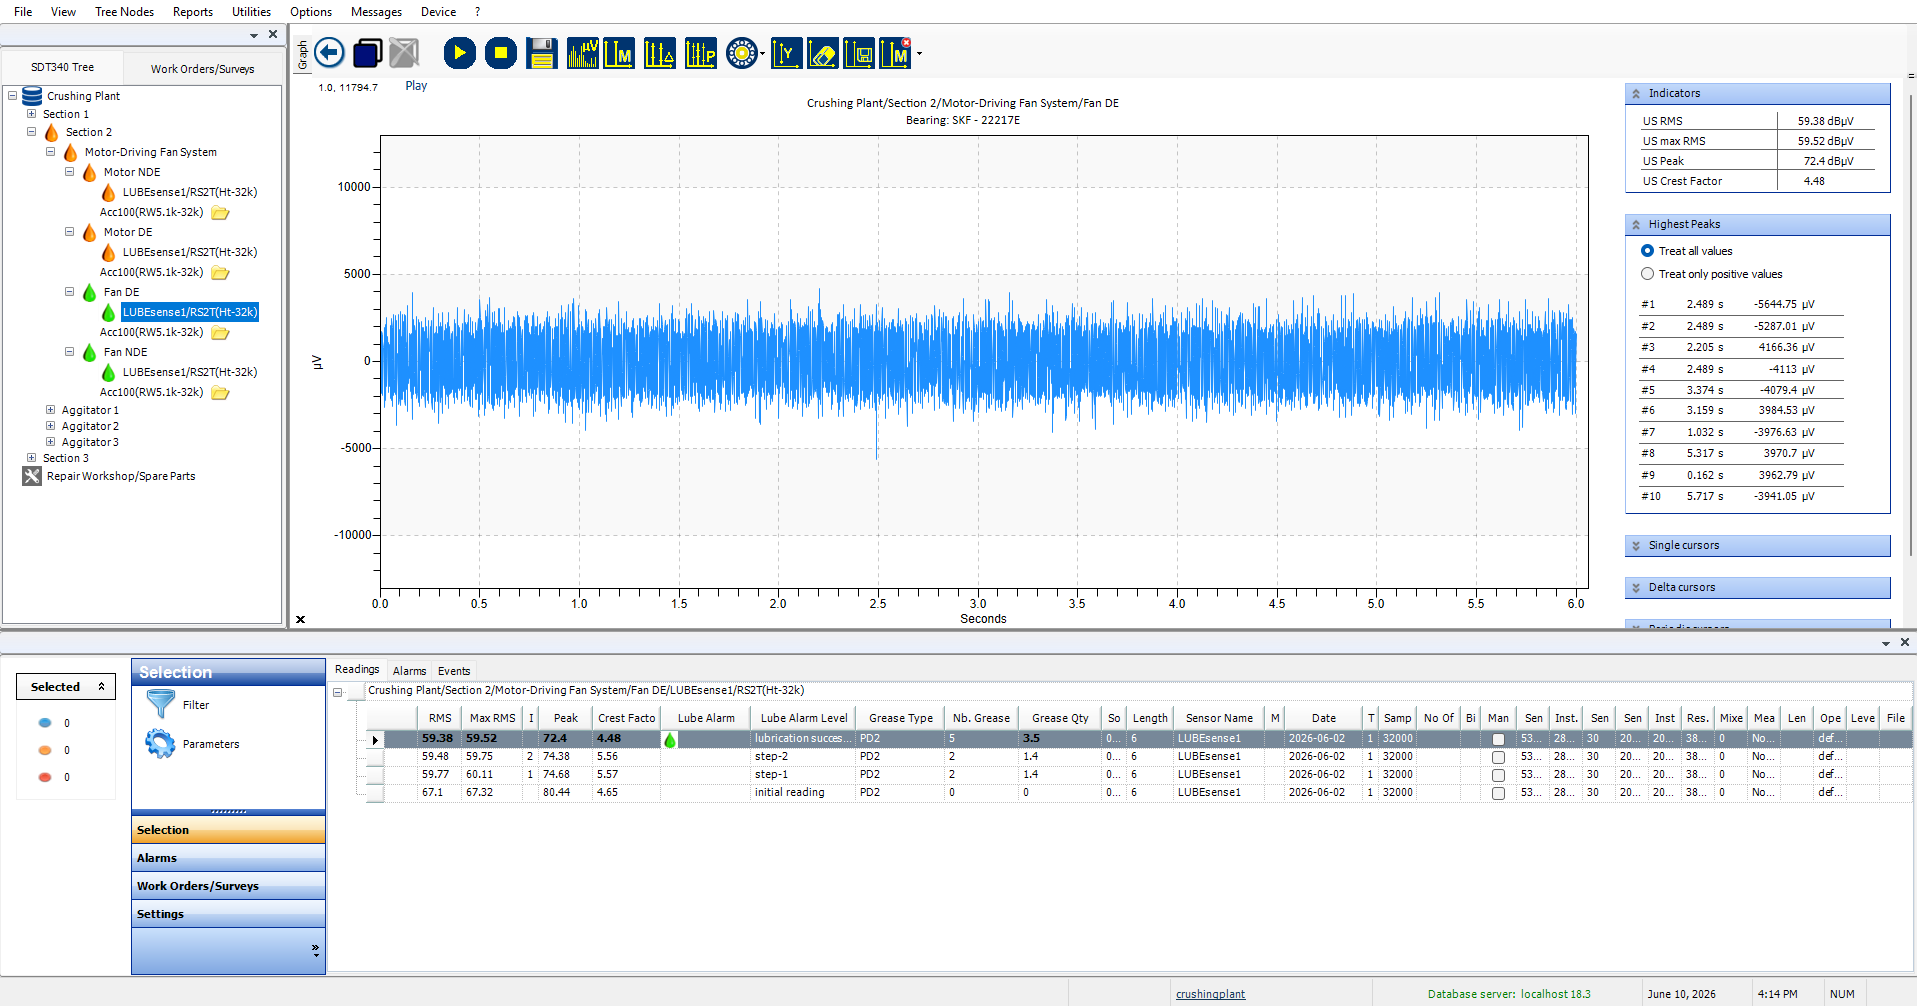
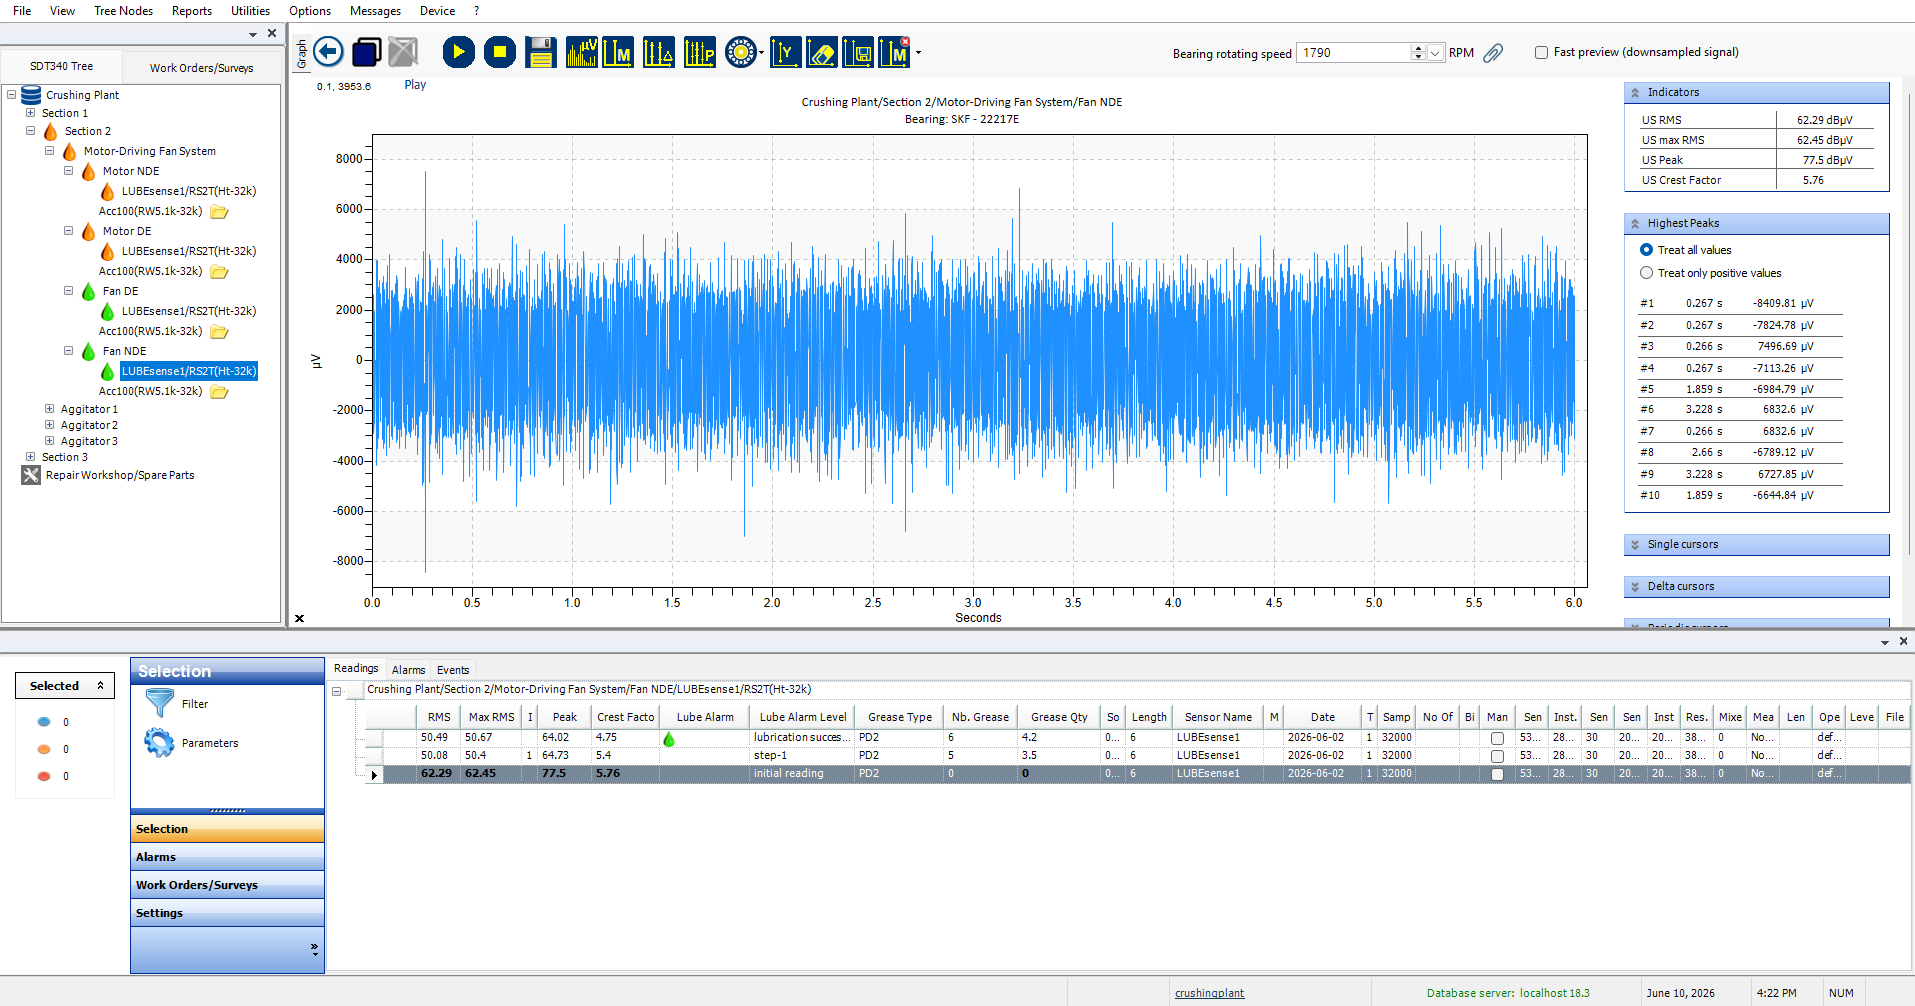
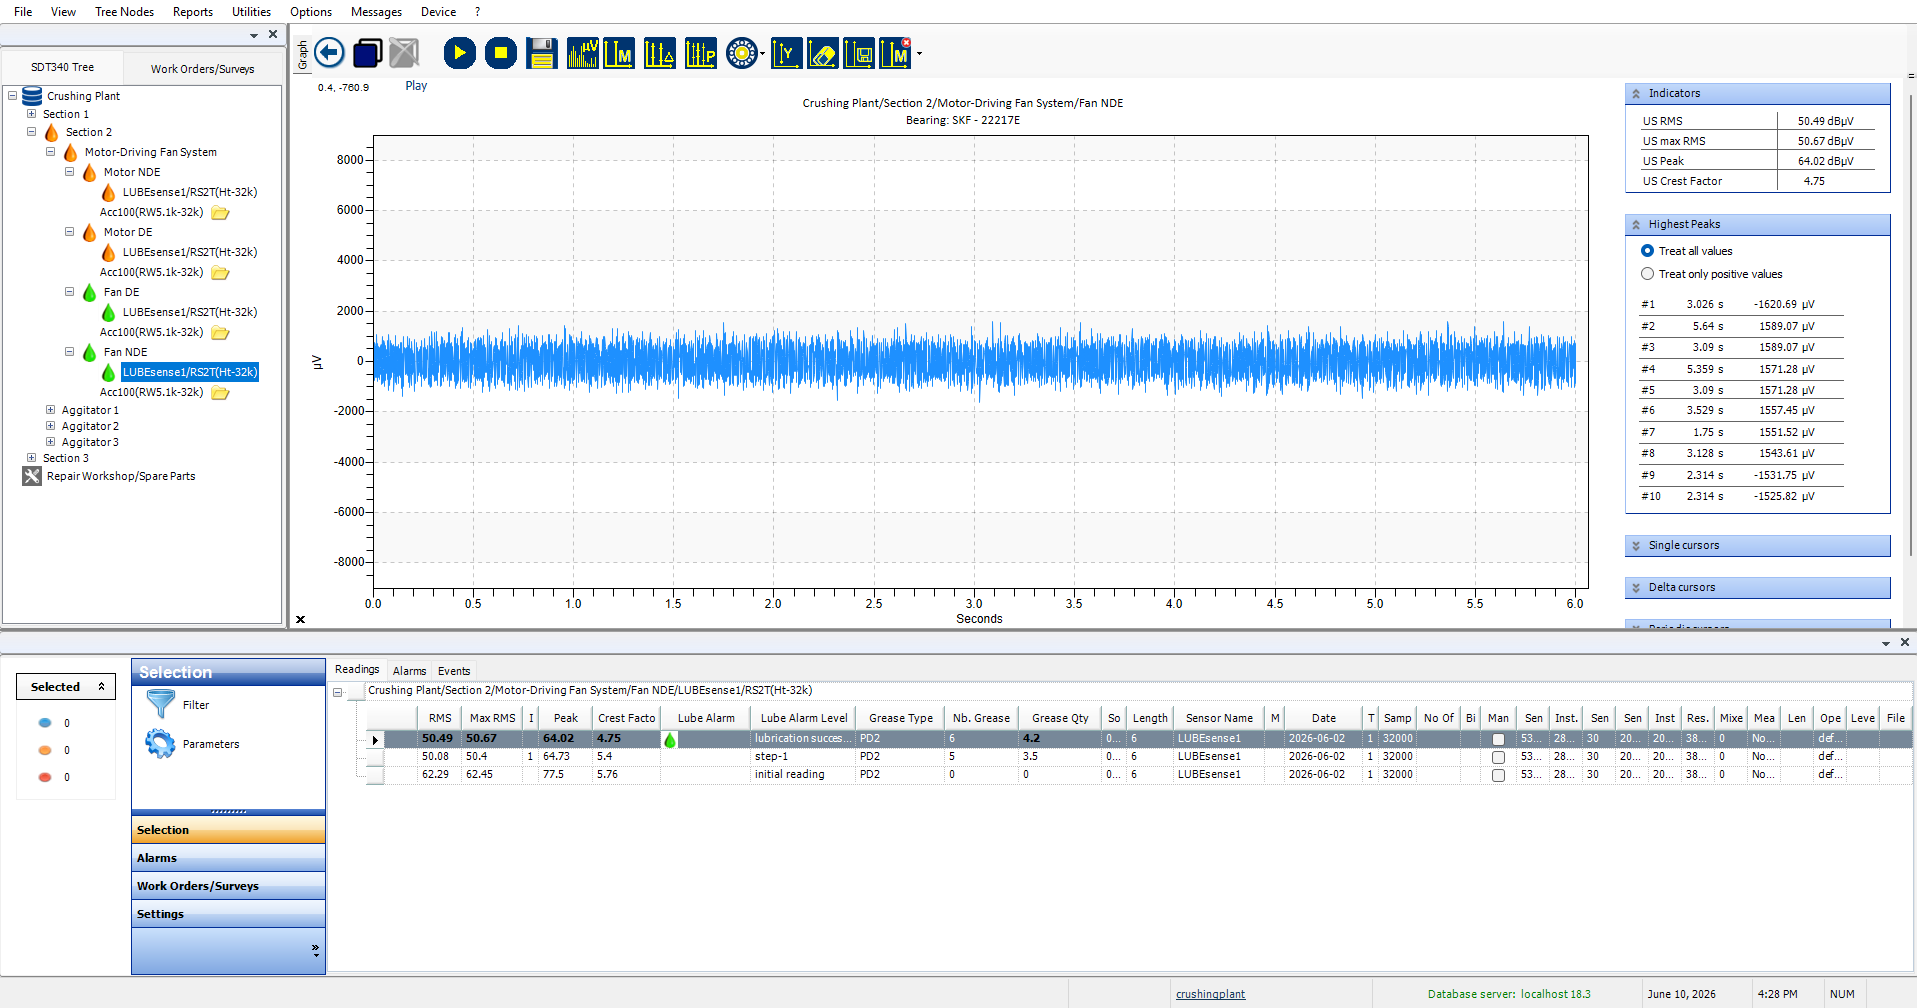
When no historical data is available, the safest approach is to let the bearing response guide the lubrication decision. The process begins with an initial ultrasound measurement to establish the starting condition. A small amount of grease is then applied, followed by another measurement to see how the bearing responds. If ultrasound levels decrease, lubrication can continue in controlled steps. If levels increase, lubrication should stop to avoid over-greasing or creating additional stress on the bearing. This step-by-step method turns lubrication into a measured decision instead of a fixed-volume task. Each before-and-after time waveform helps confirm whether the bearing accepted grease, rejected grease, or required further investigation.Motor NDE Bearing - Time Waveform Review
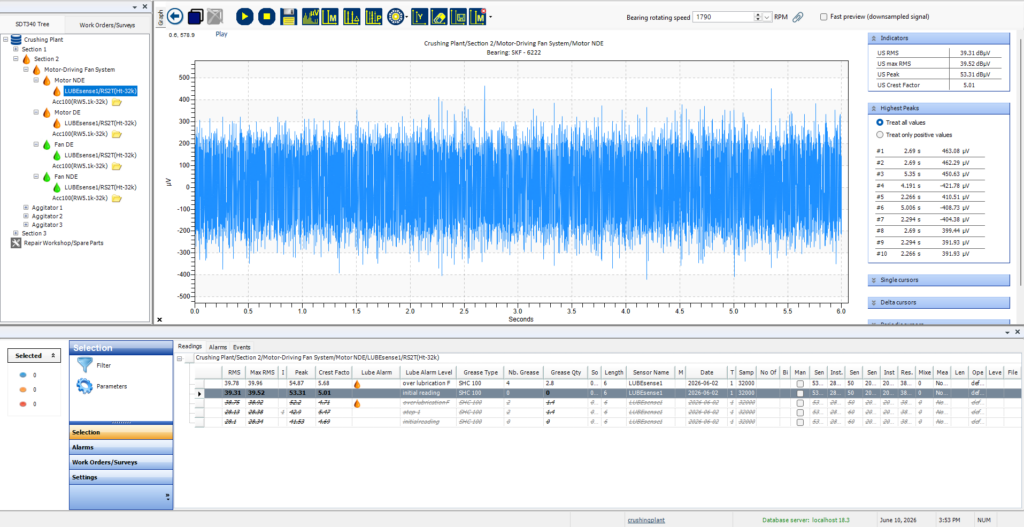
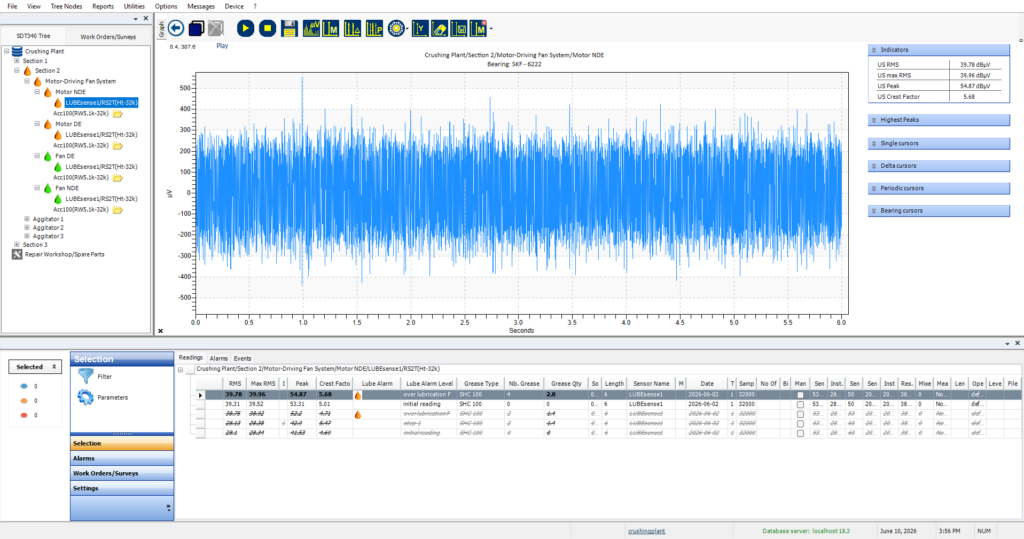
Motor DE Bearing - Time Waveform Review
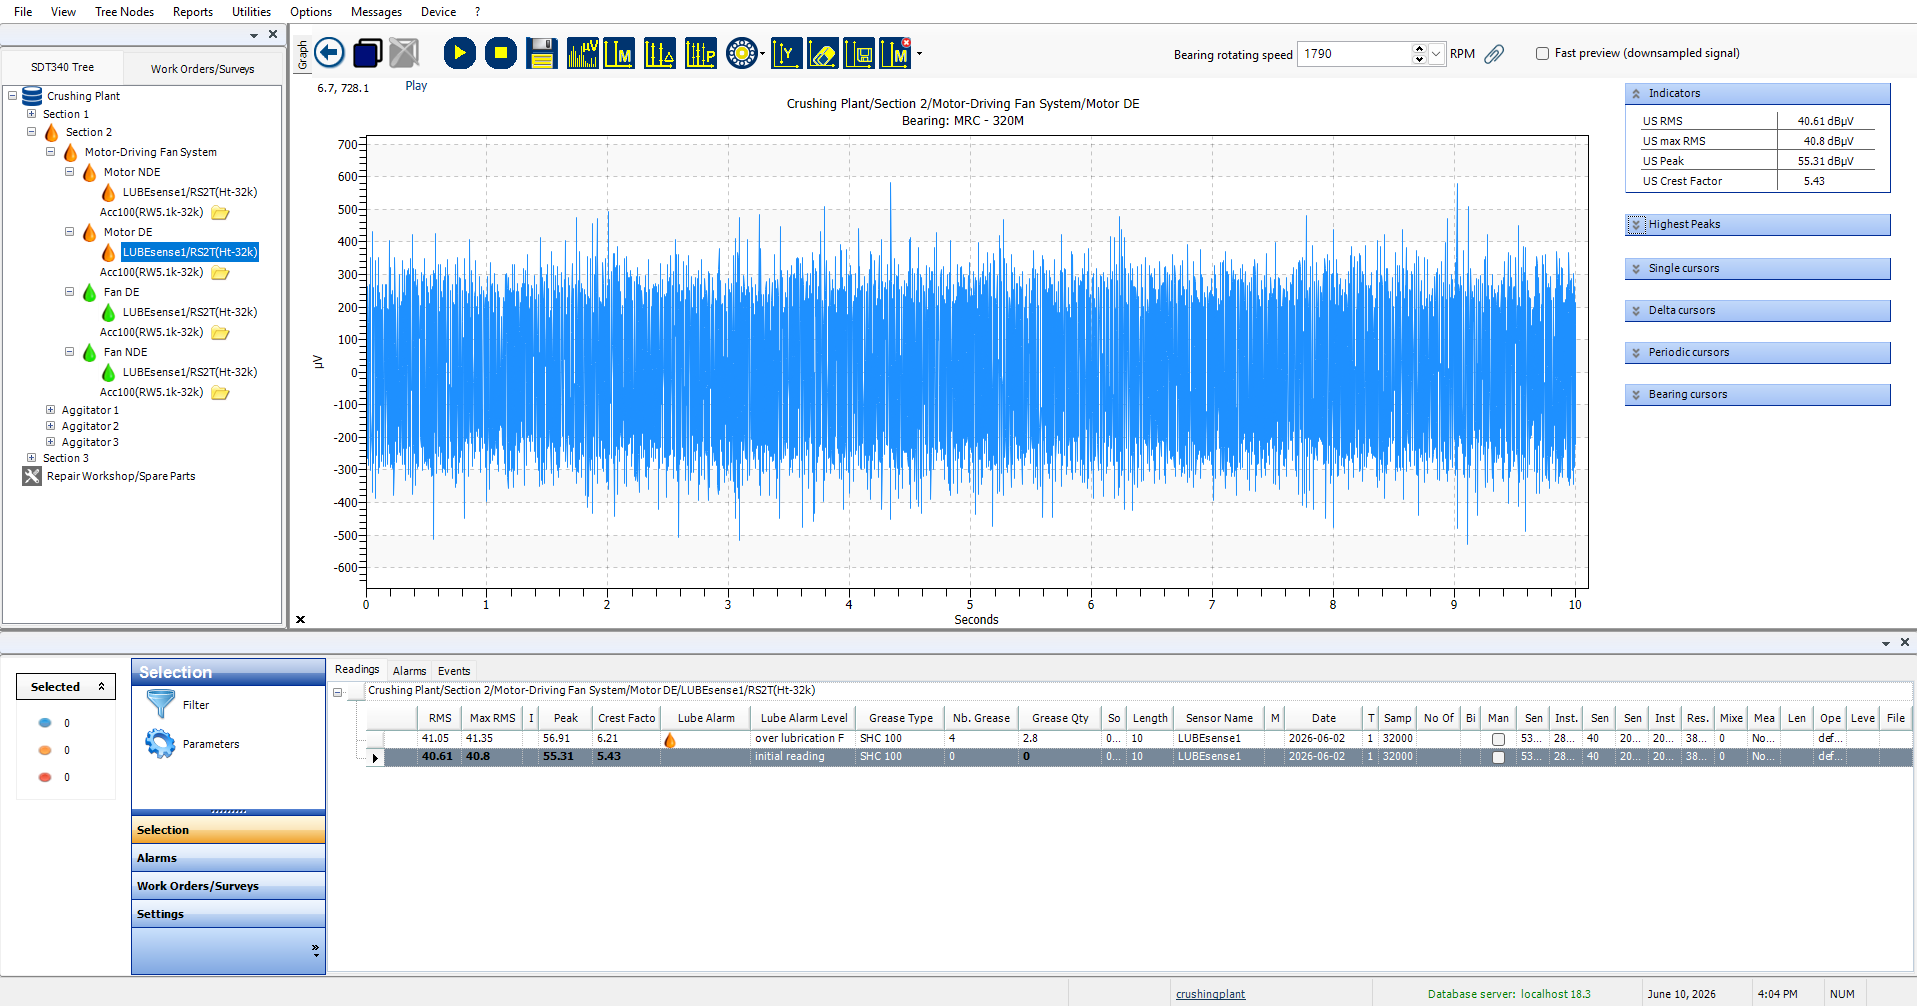
Fan DE Bearing - Time Waveform Review
Fan NDE Bearing - Time Waveform Review
2. Transition: From Lubrication Task to Dynamic Analysis
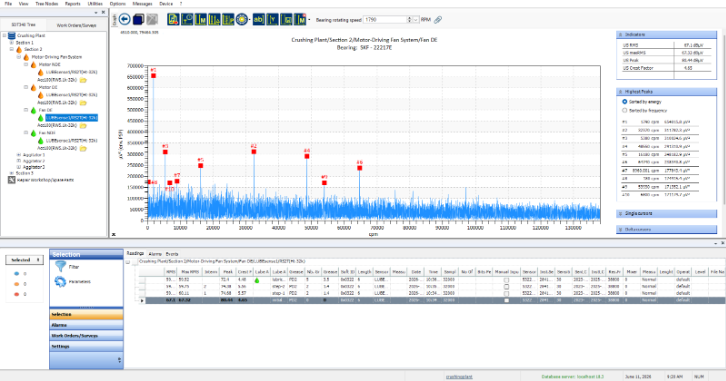
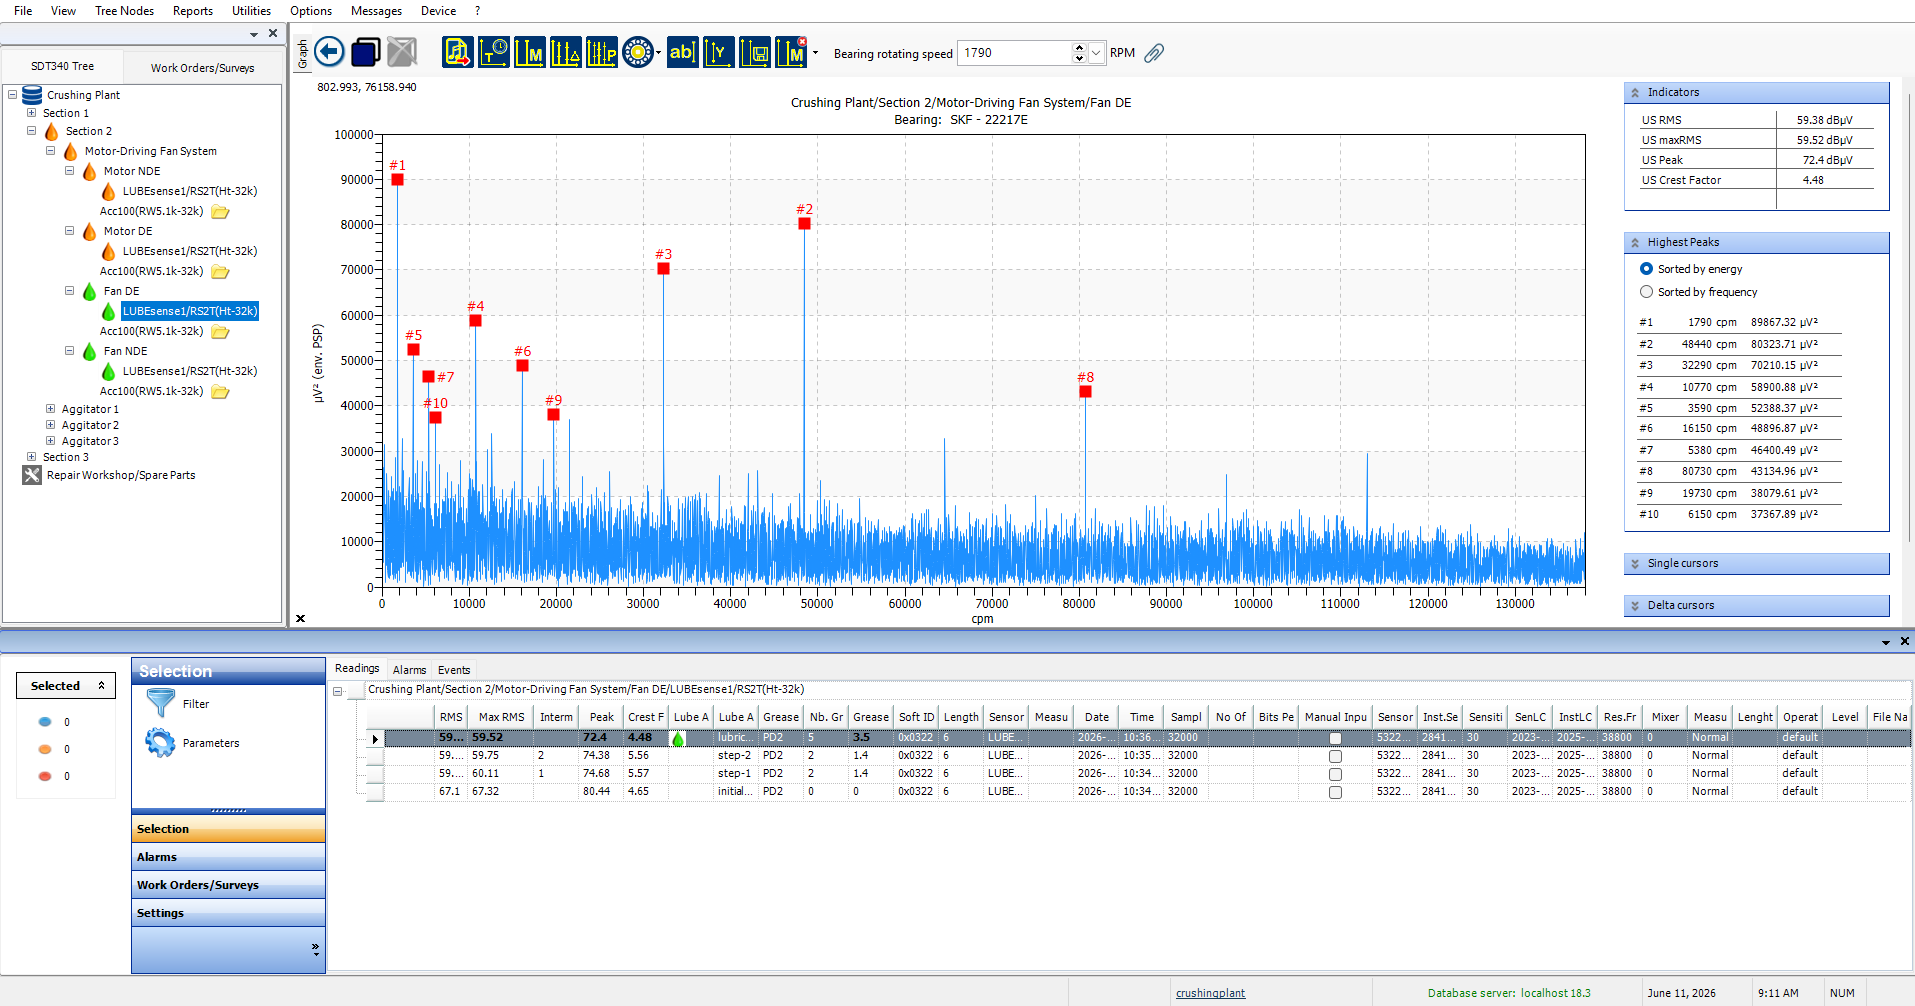
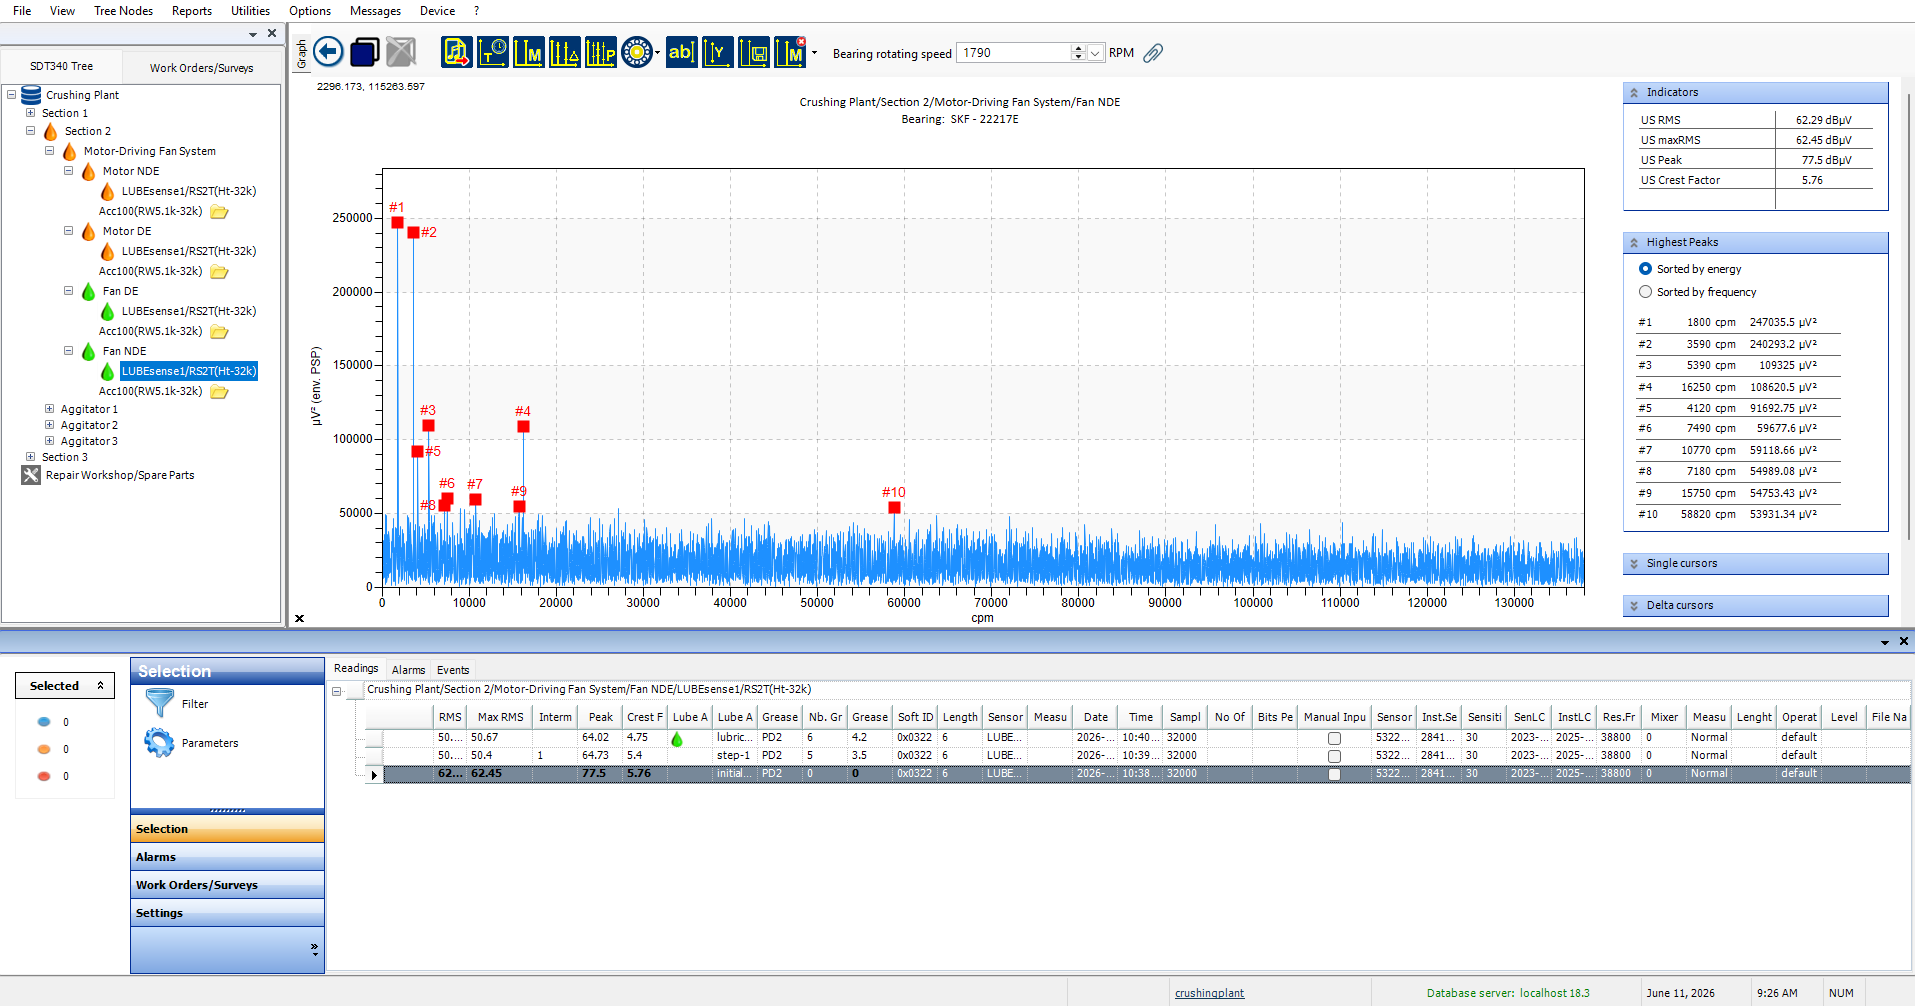
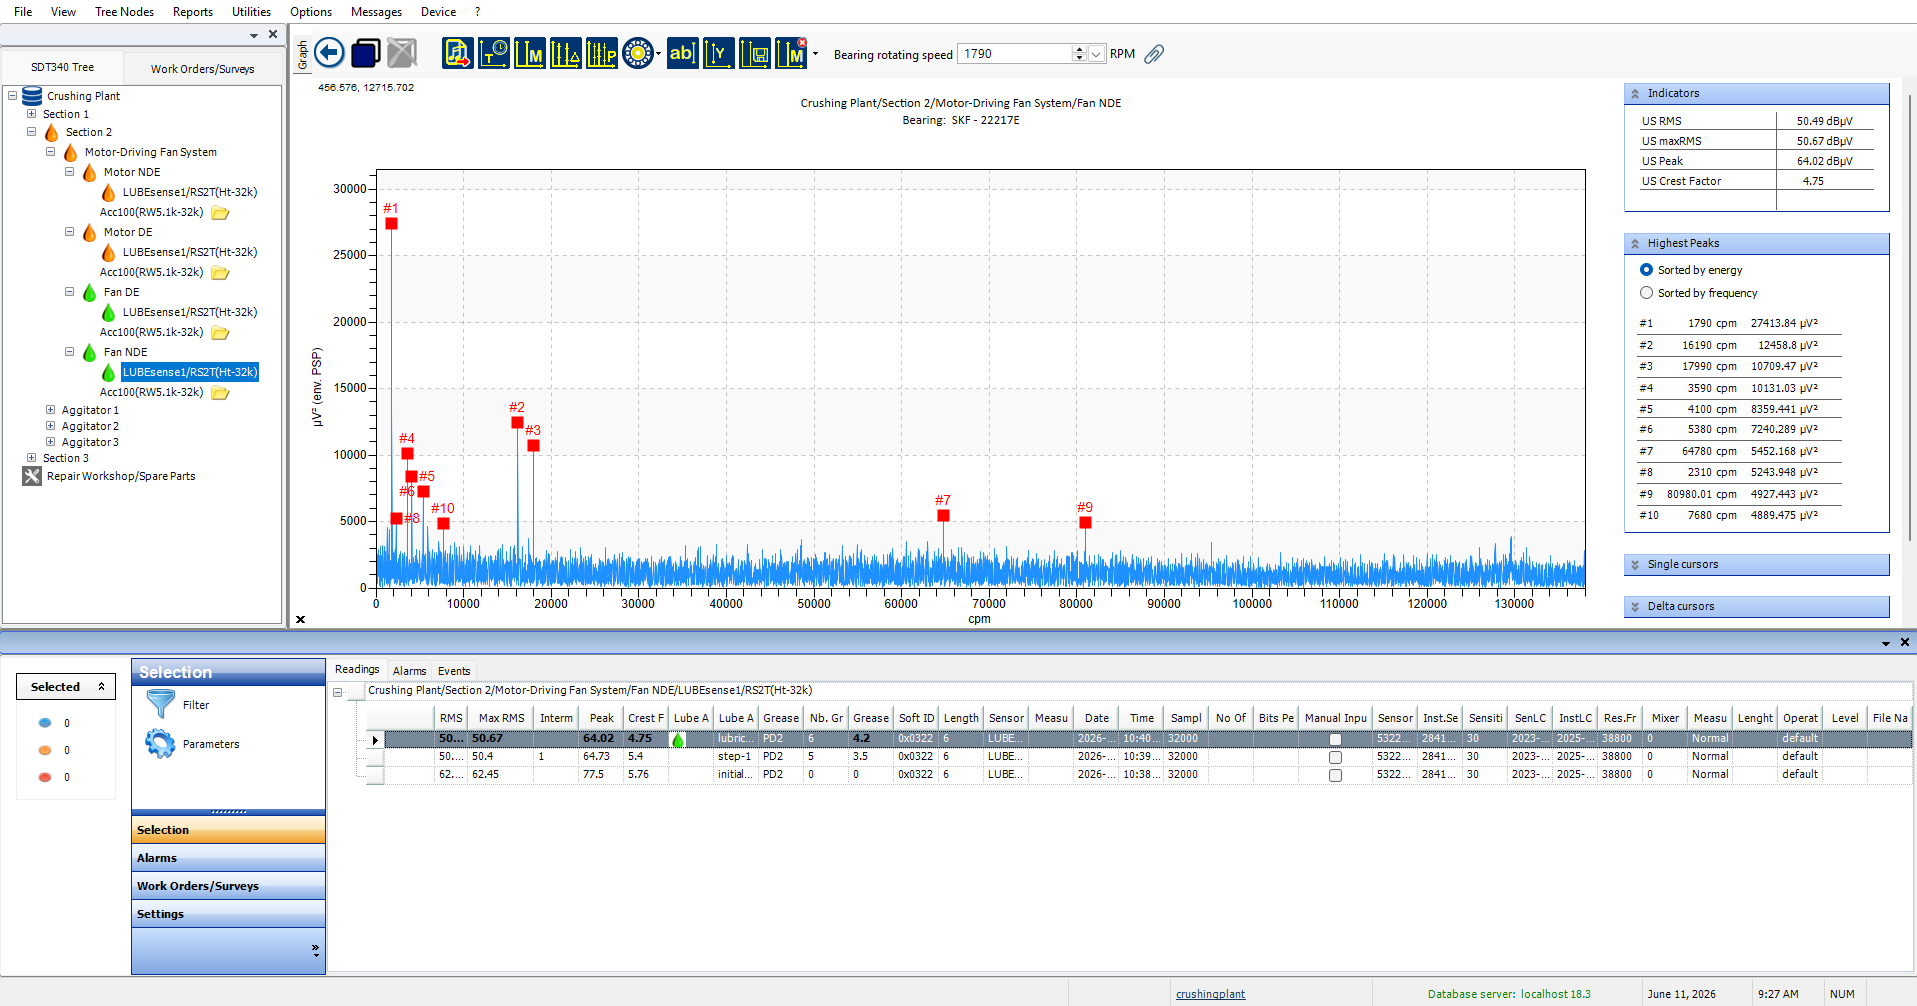
The time waveform data confirmed whether each bearing accepted grease, but it did not tell the whole story. Because the SDT340 LUBExpert Mode can save dynamic signals during the lubrication task, the same measurements can be opened in the FFT spectrum for more advanced analysis. In the spectrum views below, the y-axis is shown as uV^2 (env. PSP), which represents the energy or power of the ultrasonic signal after envelope processing. This is why the fan spectra appear on a much larger scale than the motor spectra. The fan bearings generated much more ultrasonic energy before lubrication. Lubrication reduced the overall signal energy significantly on the fan bearings, but the running speed pattern remained visible. This is the key finding: grease reduced friction, but it did not remove the underlying mechanical looseness signature. In other words, lubrication may have masked the severity of the issue, but it did not correct the fault.Motor NDE Bearing - FFT Spectrum Review
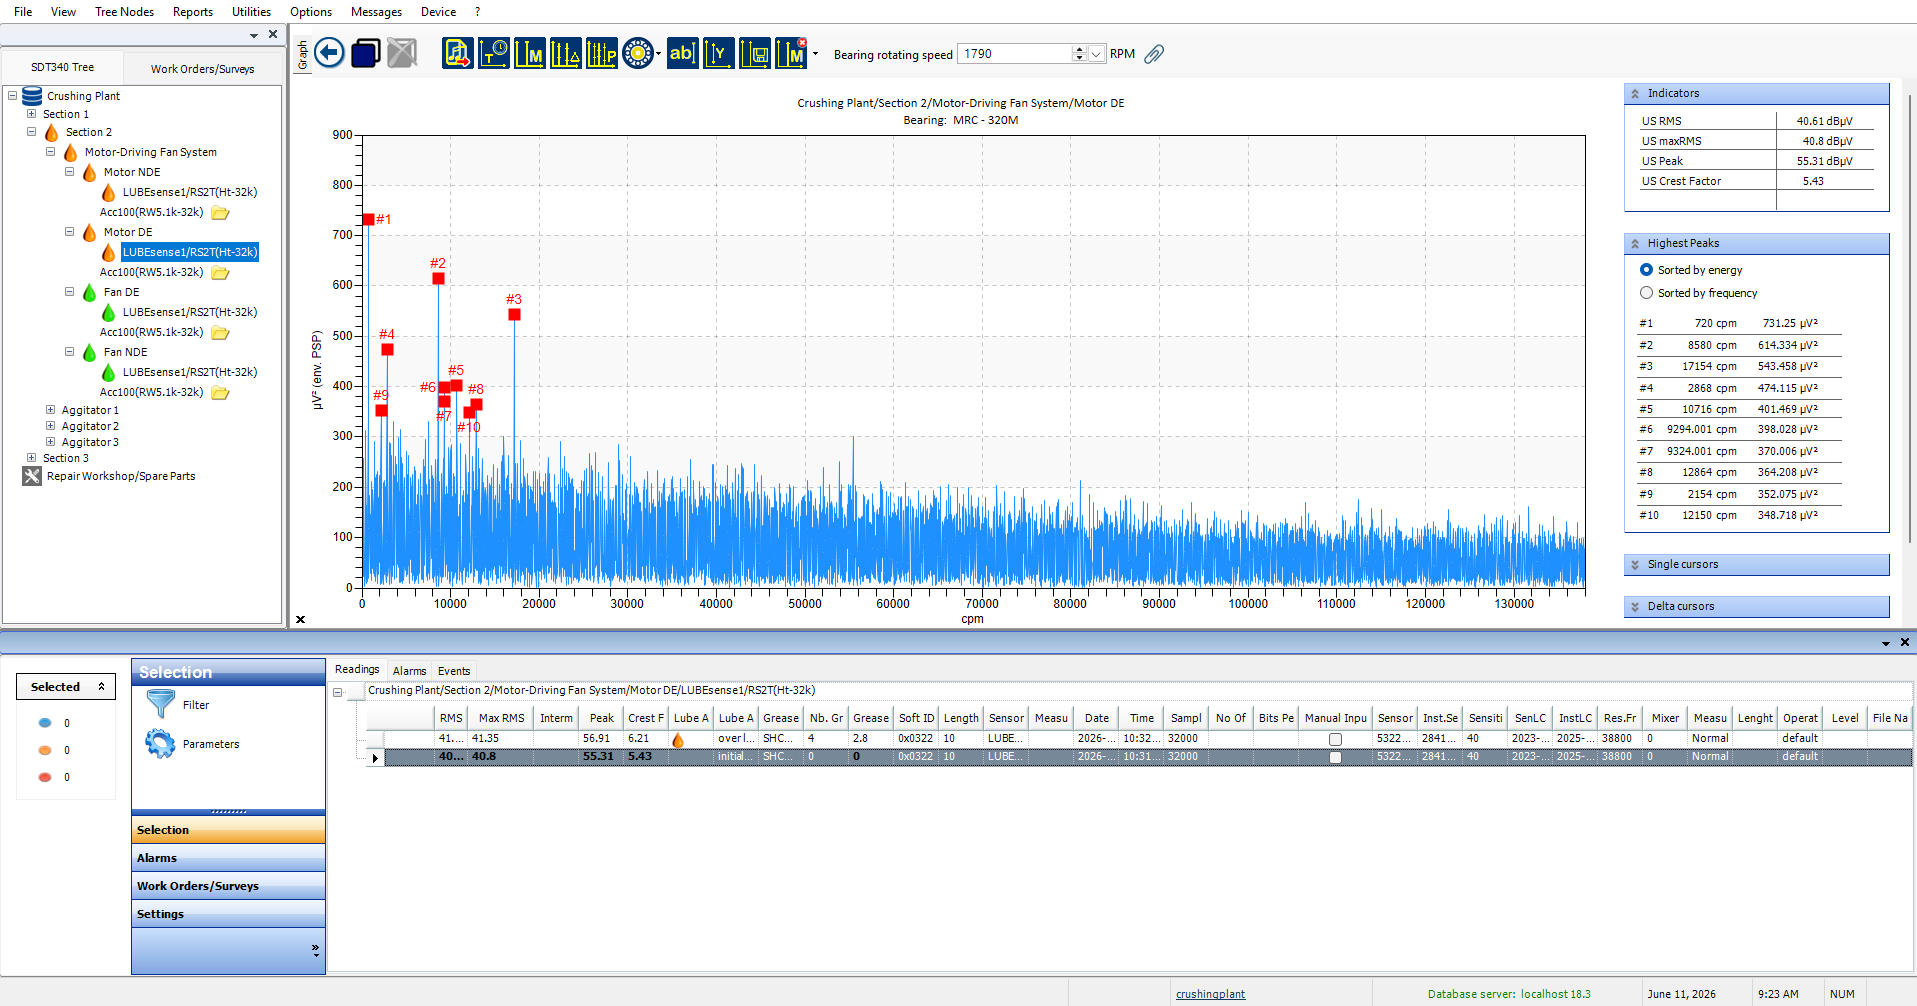
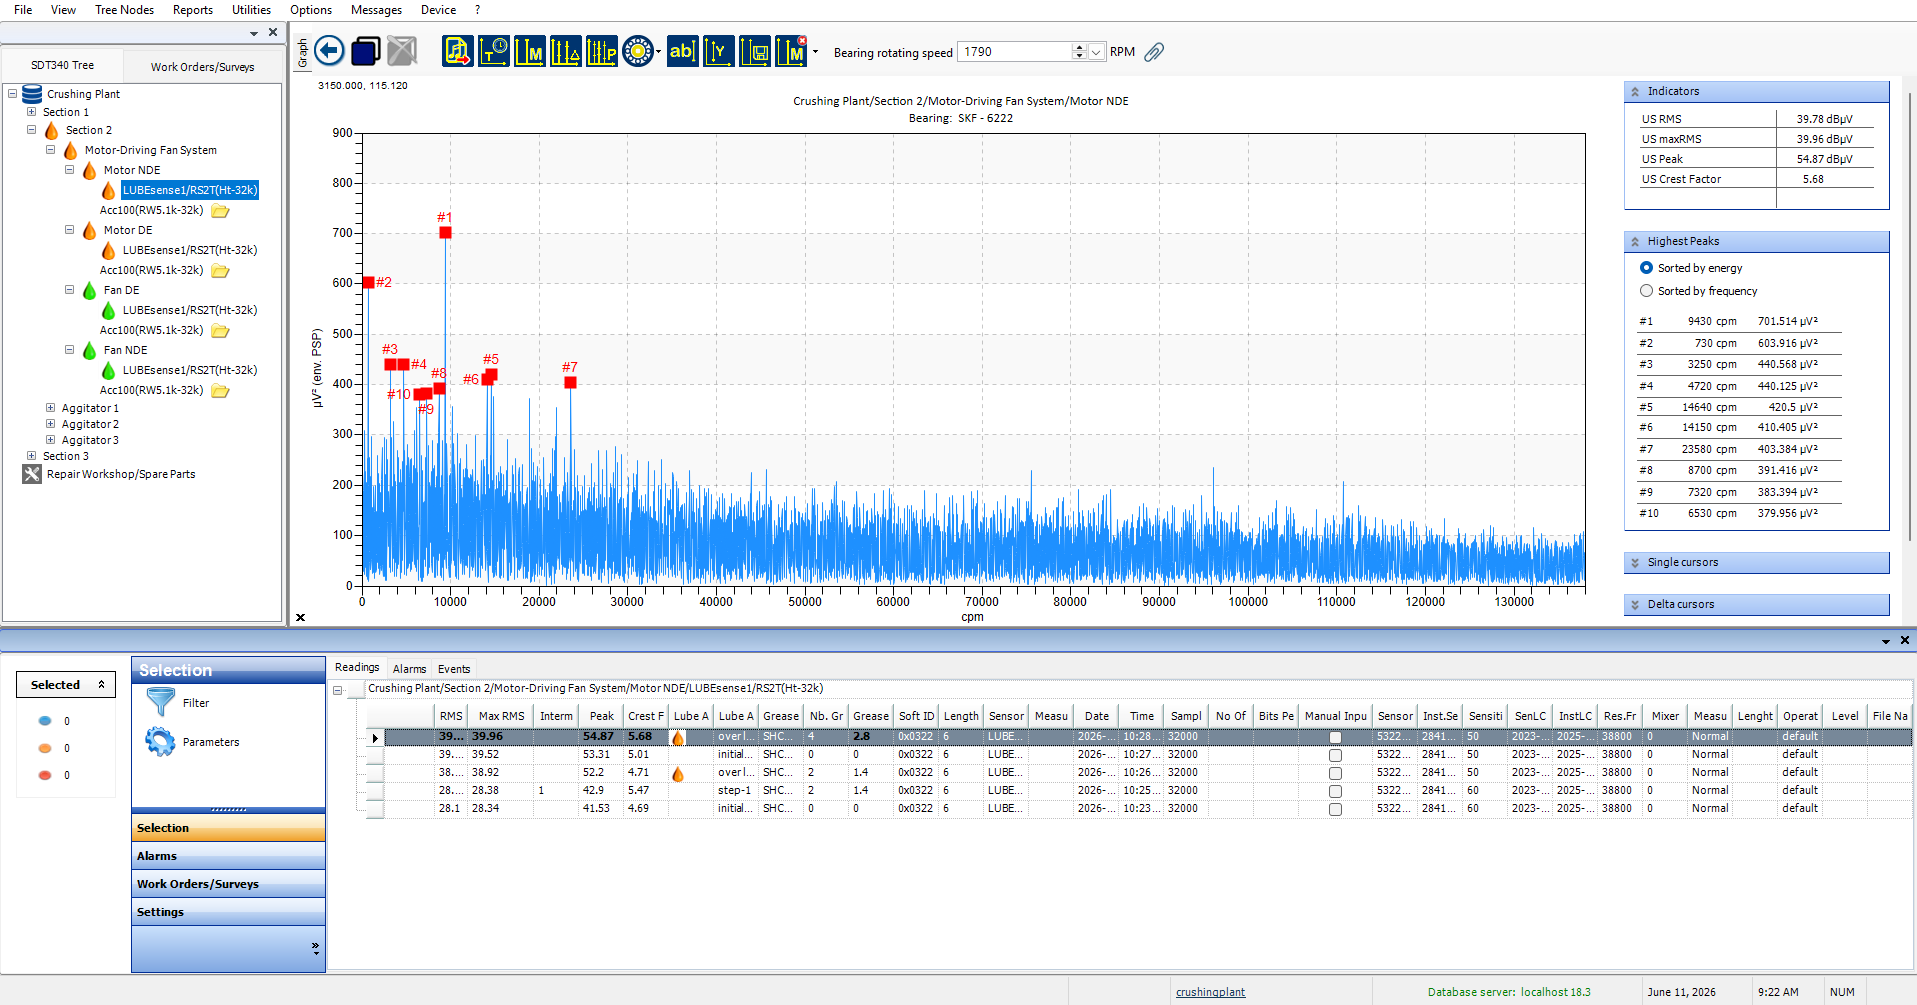
Motor DE Bearing - FFT Spectrum Review
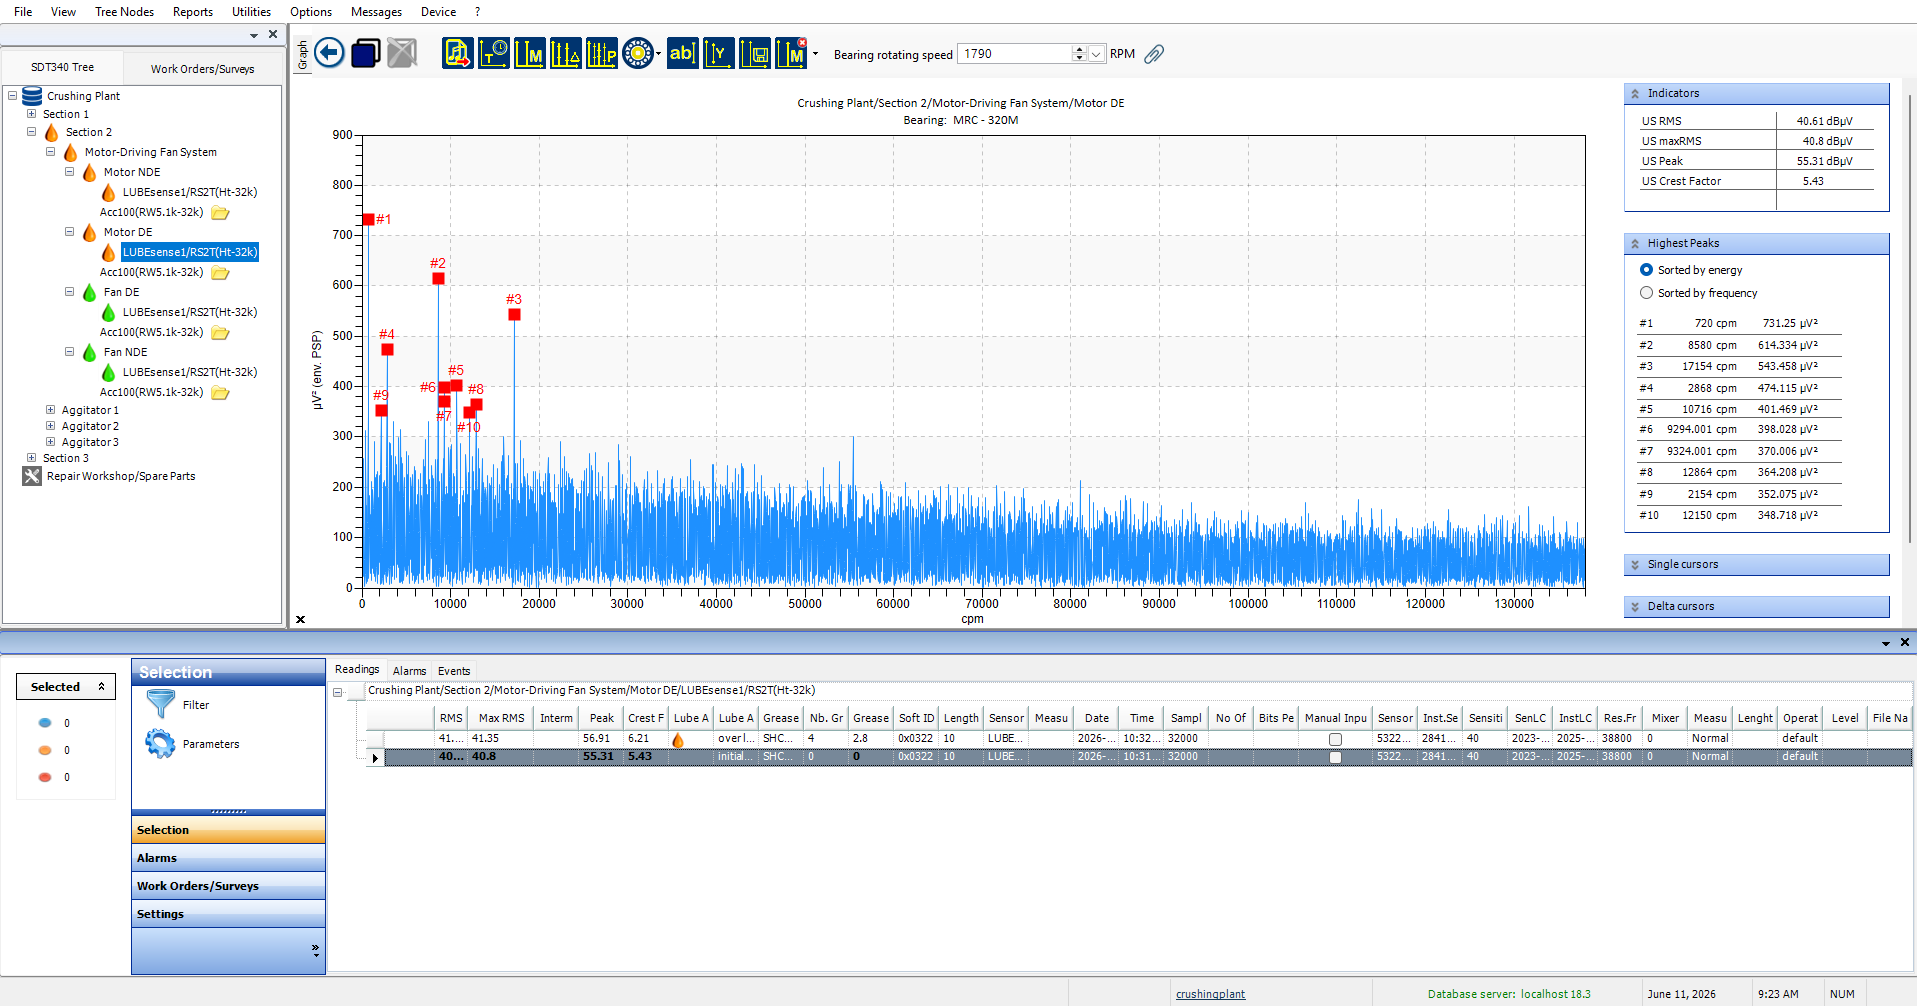
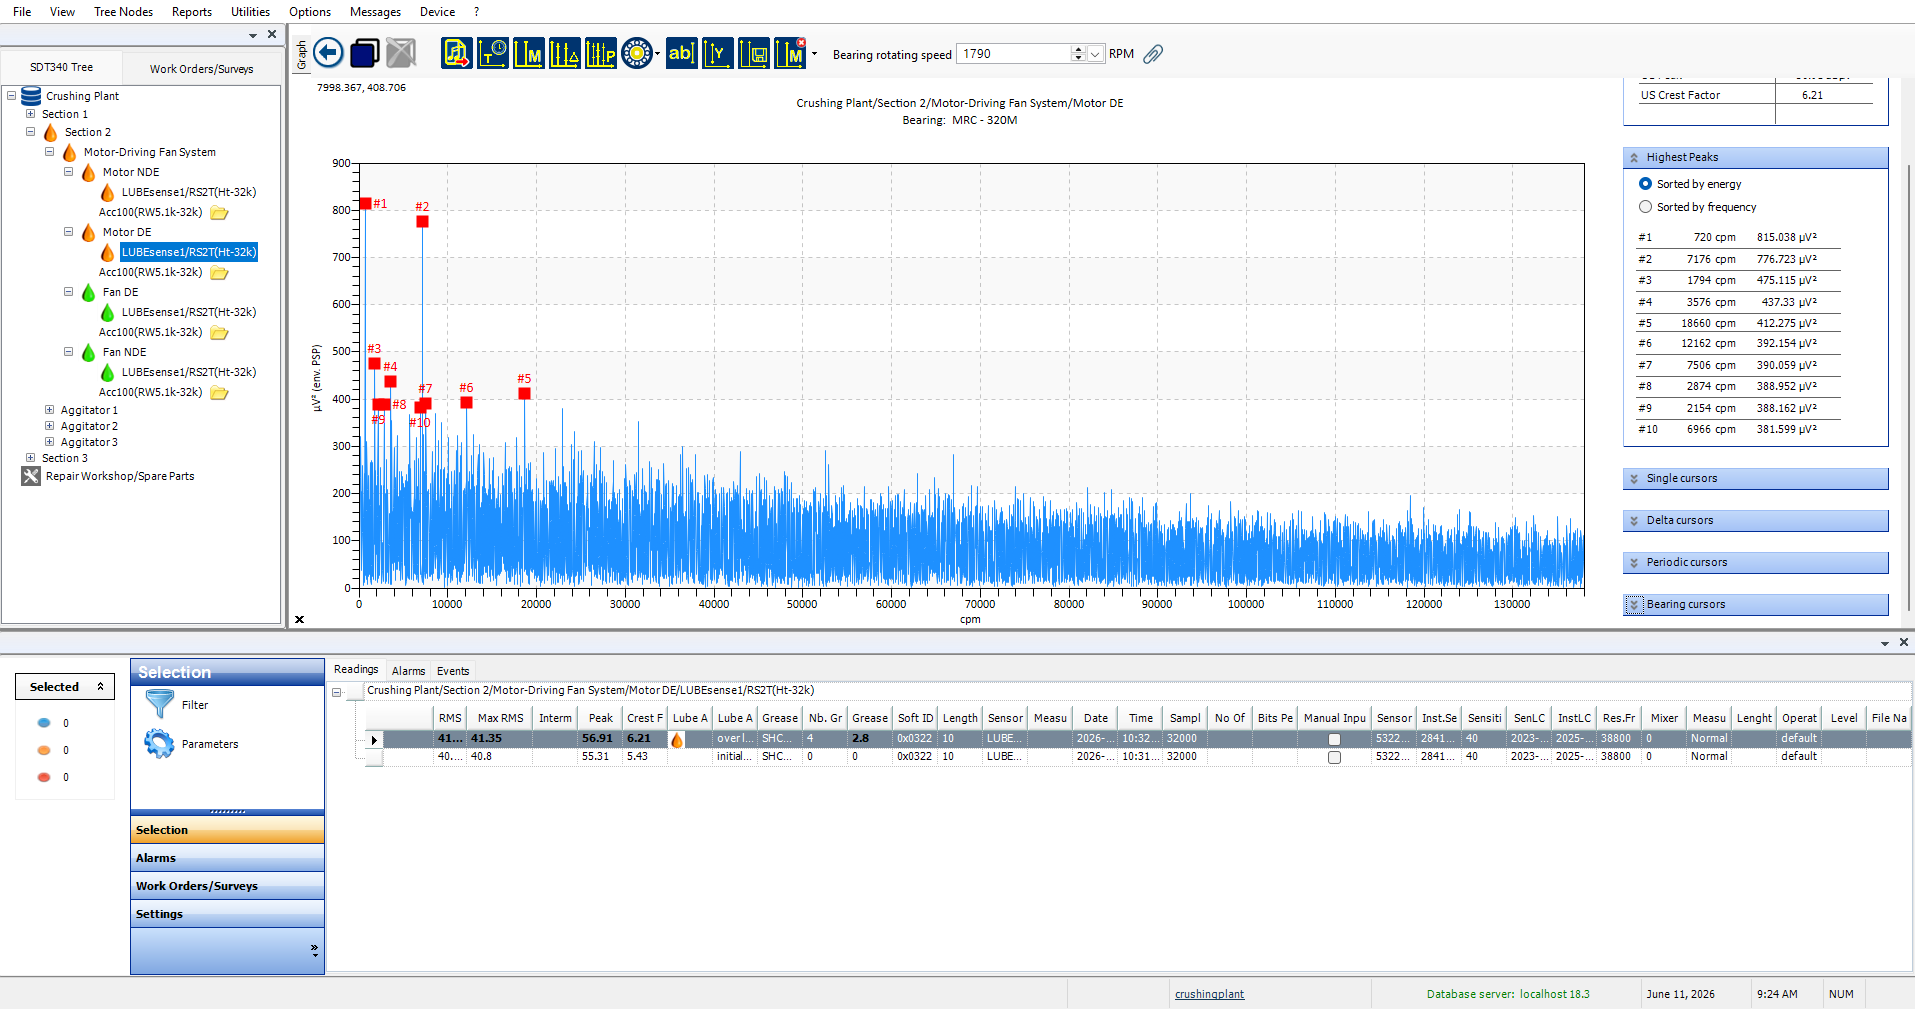
Motor DE Bearing - FFT Spectrum Review
Fan NDE Bearing - FFT Spectrum Review
Conclusion: Lubrication Data as Condition Monitoring Insight
This case shows why lubrication data should not be treated as a simple record of how much grease was applied. The motor bearings did not show a positive friction response, so lubrication was stopped. The fan bearings did respond to grease, but the dynamic data revealed something more important: a suspected mechanical looseness condition near the Fan DE bearing. The Fan DE bearing showed the strongest 1X running speed impact and harmonic activity. The same pattern was visible but less pronounced at the Fan NDE bearing, and it was weaker or less relevant at the motor bearings. Comparing the same pattern across the full motor direct-drive fan assembly helped localize the suspected source of looseness. For maintenance teams, this is the value of combining ultrasound-guided lubrication with dynamic analysis. Grease can reduce friction and lower overall signal energy, but it cannot correct mechanical looseness. By saving and reviewing dynamic lubrication data, teams can identify issues that might otherwise be temporarily masked by lubrication and missed until they become more severe.
Share: